In the Beginning... Much longer lifespans
In Genesis chapter 5 is a list of Adam's initial descendents for many generations.
The lifespans are mostly more than 900 years. In Genesis chapter 11 is a list
of Noah's initial descendents for many generations. The lifespans are decreasing
rapidly. Eventually the lifespans of people resemble our own. It is often
questioned whether the long lifespans are a myth, unreal. They are certainly
unreasonable by today's standards.
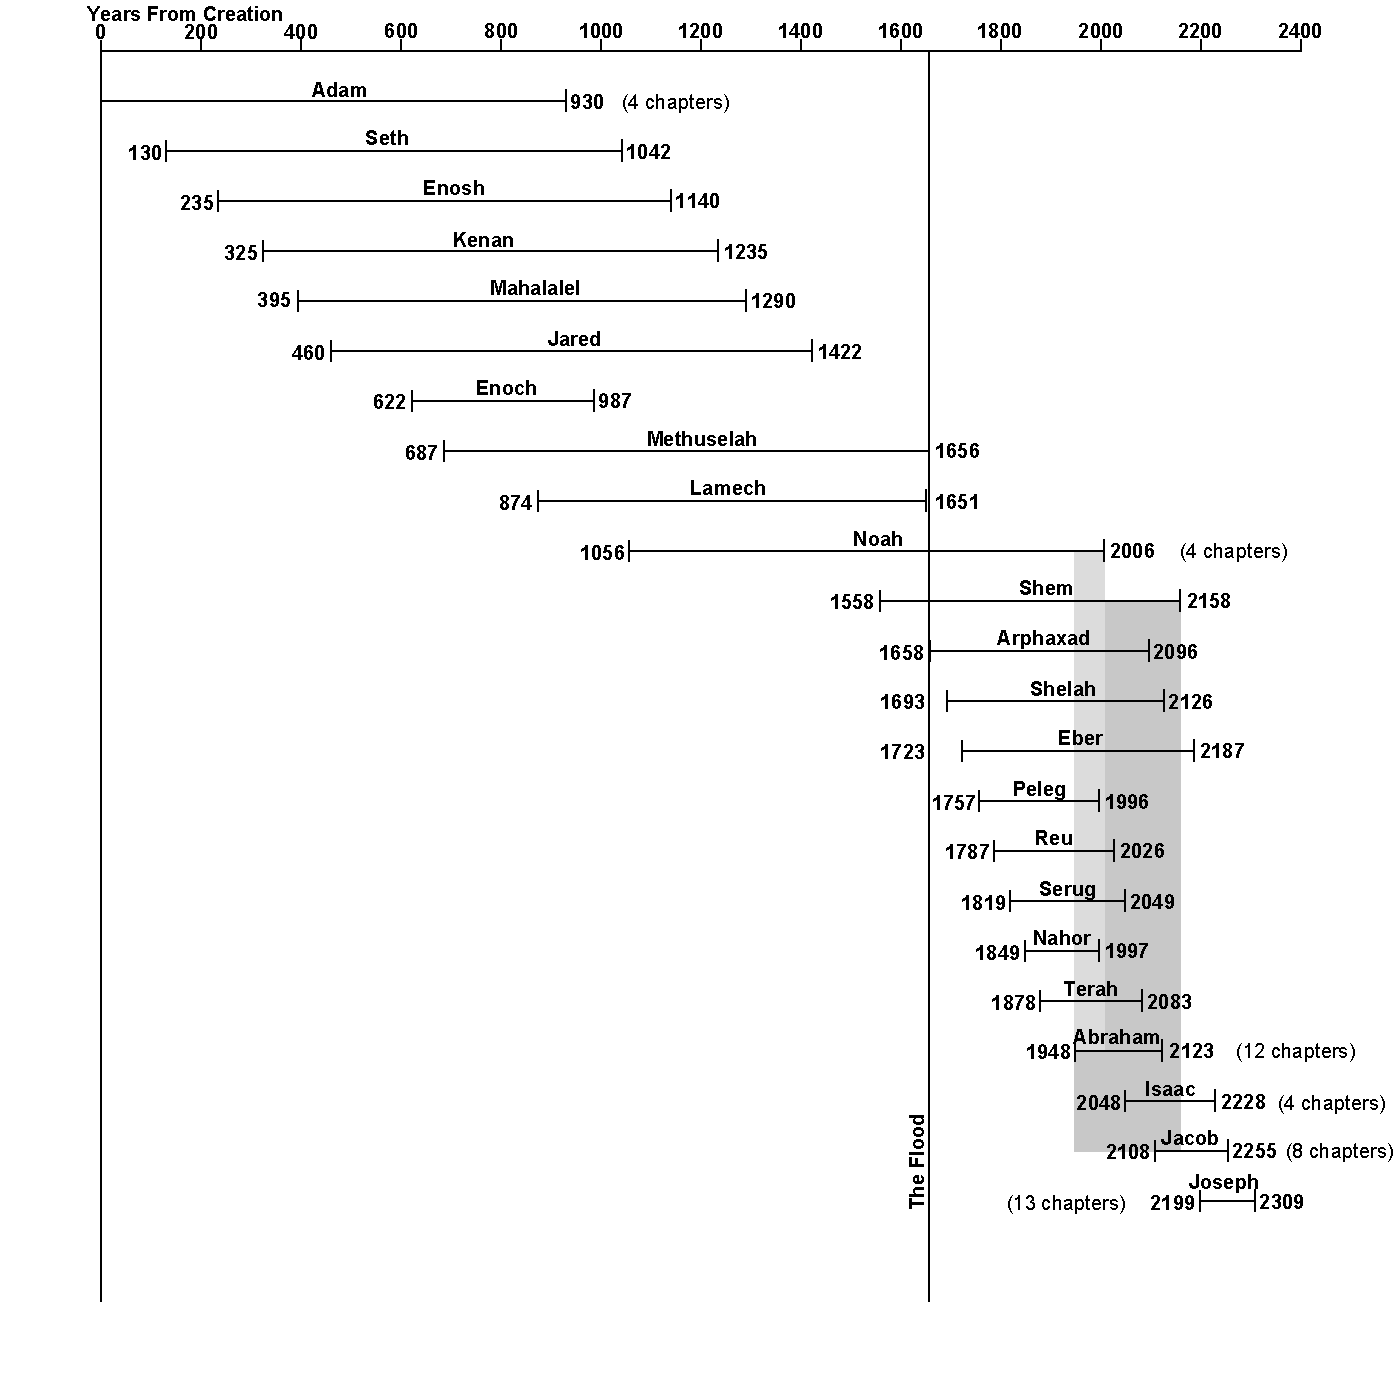
The data in these and other chapters can be taken at face value and plotted on
a timeline beginning at Creation, showing the birth year and death year of
this list of people.

In this graphic there is a vertical line at the time of the worldwide Flood.
Only the lifespans of Noah and Shem cross this line. That of Methuselah, the
longest-lifing man, abruptly stops at that line. I have read that the meaning
of his name is "His death shall bring" or "In the year he dies, it shall come"
but without mentioning the ominous thing that is coming. It was the Flood.
The graph also shows that only one person between Adam and Noah was needed to
pass on stories of Creation to Noah. After the Flood, Abraham overlapped
Noah by 58 years, easily enough time for a direct sharing of stories between
them. Shem, another survivor of the Flood, lived 35 years beyond Abraham and
even overlaps Jacob by 50 years. So there was little chance of distortion of
stories because of retelling them through many people. Only a few people were
needed for accurate recording and retelling of history.
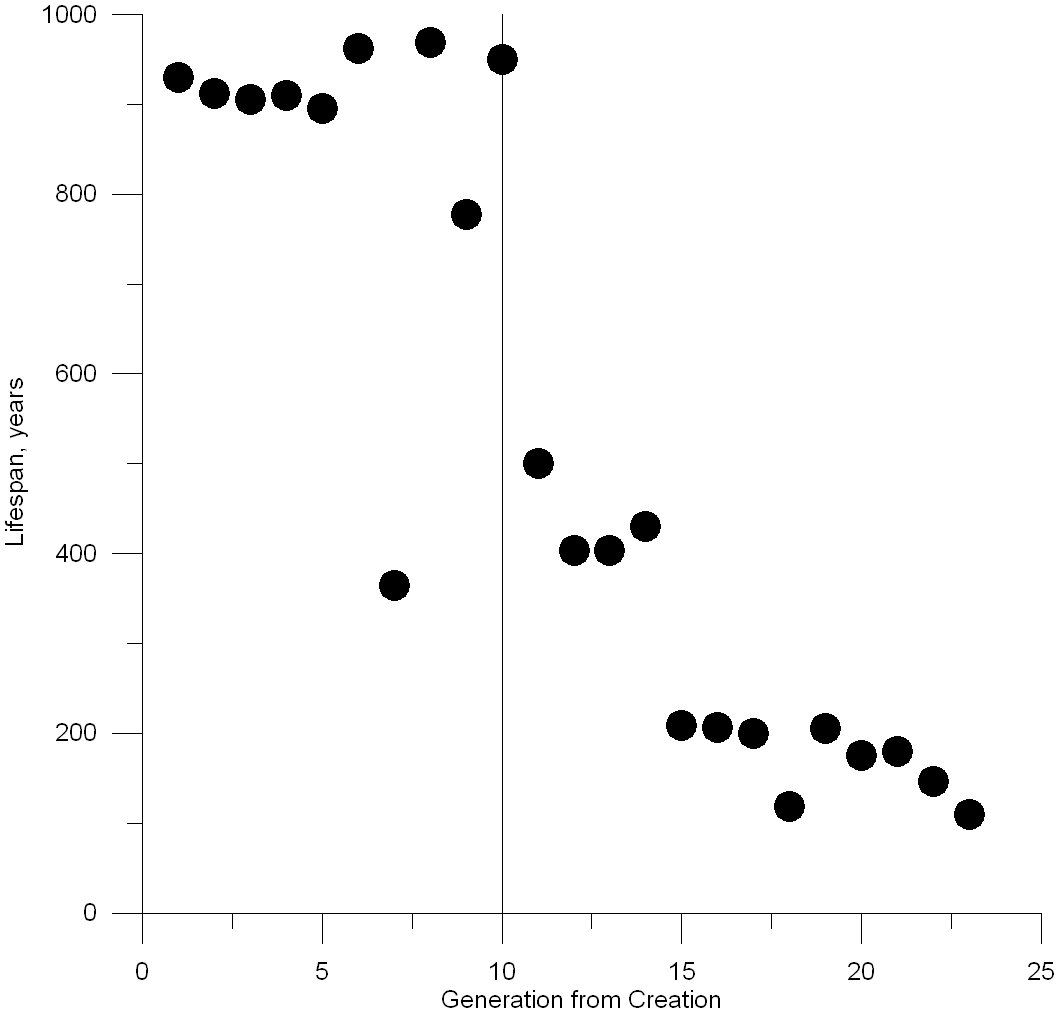
A different style of graph can be plotted, showing the lifespan (age at death)
versus generation from Adam.
 with a linear lifespan vertical axis. The vertical
line is for the time of Noah and the Flood.
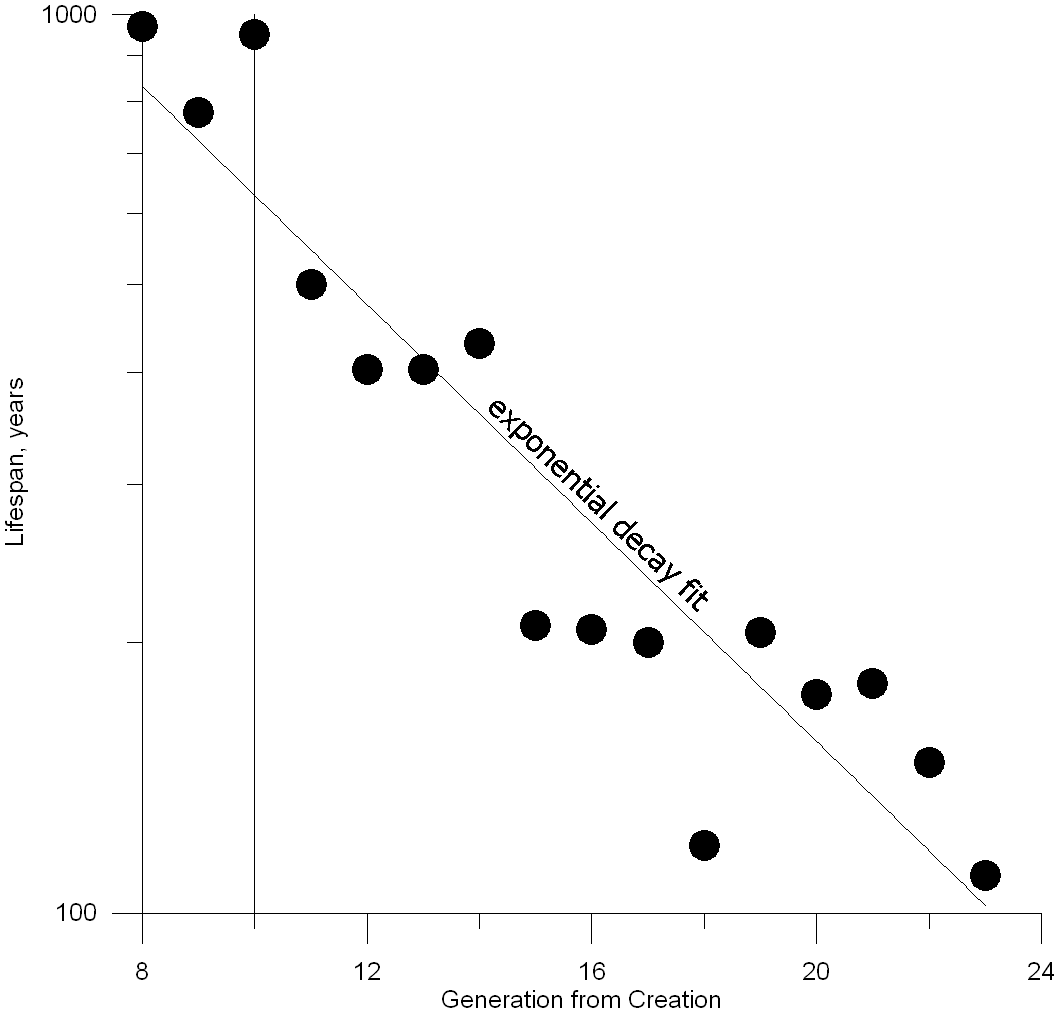
Scientists can plot certain types of data on a graph in which the vertical
axis is logarithmic (like powers of ten) and the horizontal axis is linear.
(called a semi-log graph) If the phenomenon has an "exponential decay", such
as electrical voltage or light brightness when a power switch is turned off,
the data points will fall on a descending straight line.
 with a logarithmic vertical axis.
Notice that the lifespans roughly follow the descending straight line in this
plot. That suggests that some physical process affecting aging is strongly
involved. Something really happened at the Flood that contributed to
deteriorating human bodies that lived less and less years until lifespans
similar to today's were achieved. So, as a scientist, I view these very long
lifespans as real and strongly affected by something associated with the
Flood, including a "genetic bottleneck" which limited the gene pool, making
certain beneficial genes to be lost forever.
The early Chinese leaders also had some long lifespans. Dr. Chan reports in
his English version book, giving the reigns of Huang Di (2697-2599 B.C.),
Emperor Yao (2357-2258), Emperor Shun (2255-2208), and Emperor Yu (2207-2198).
The first two are hundred year reigns, indicating that the lifespans were
even longer. Later reigns were normal compared to our expectations.

 with a linear lifespan vertical axis. The vertical
line is for the time of Noah and the Flood.
 with a logarithmic vertical axis.